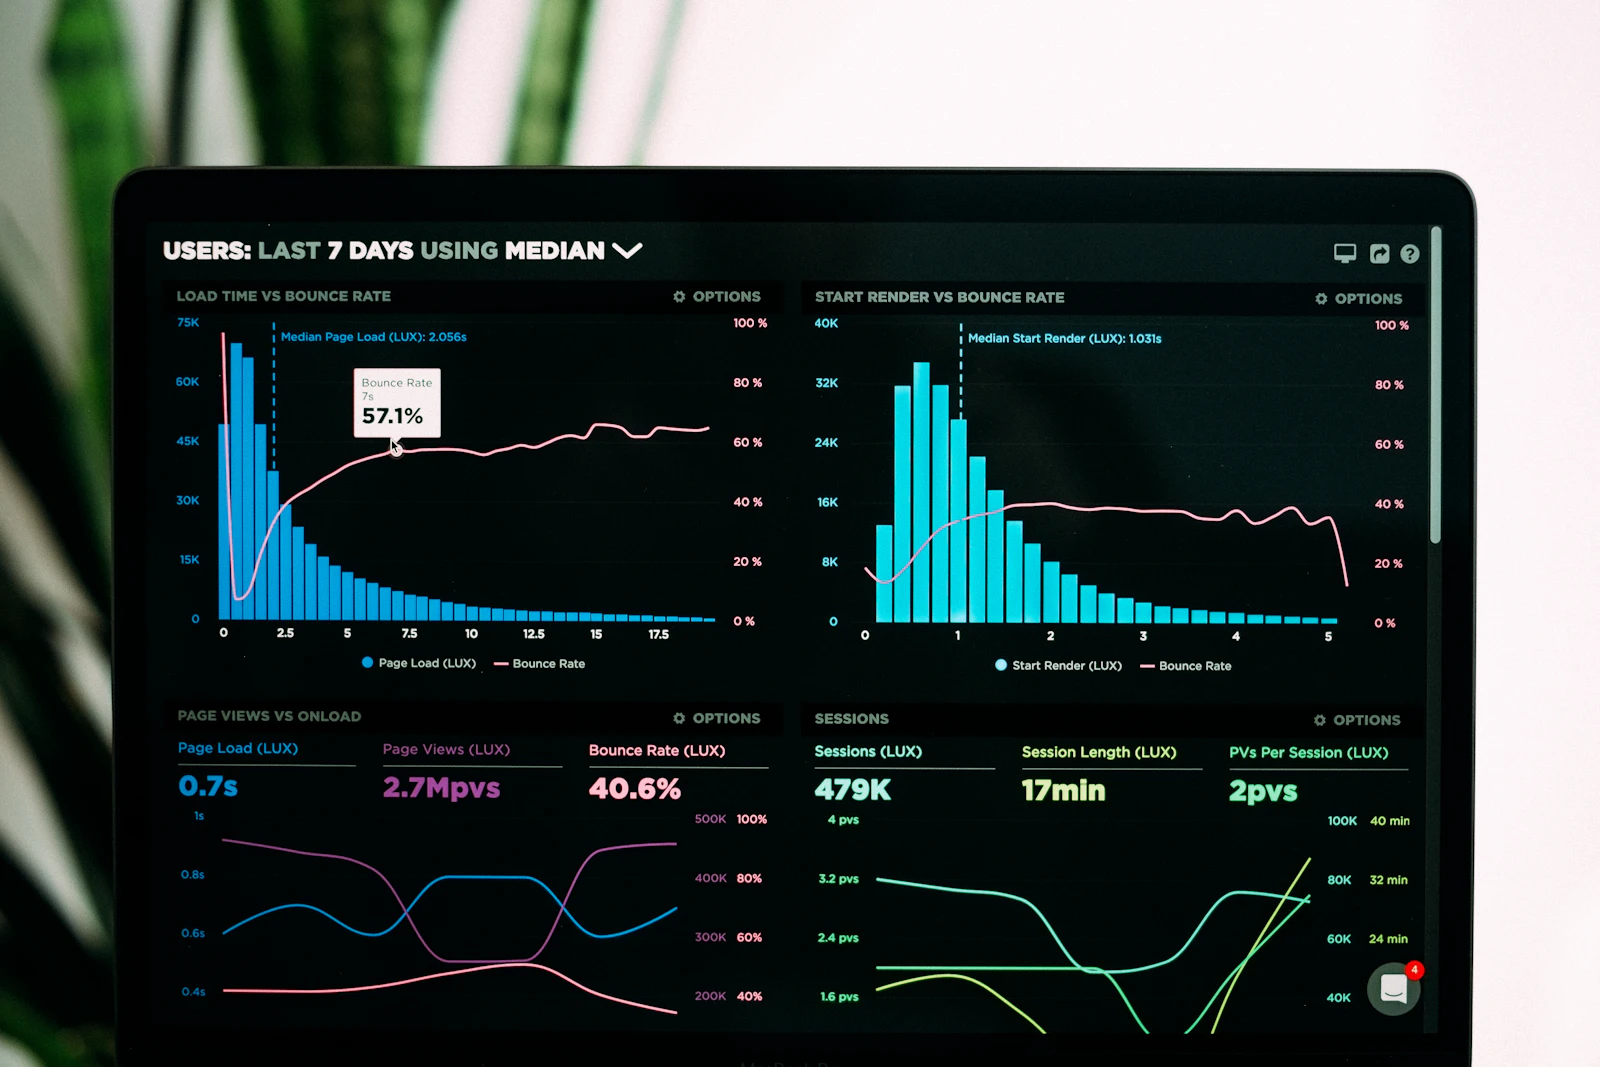
Data visualizations representing impact evidence

Impact overview

Creative infrastructure.

Peer-reviewed research, federal data, and independent analyses show the returns on creative workforce investment. Every number is traceable to its source.

The Evidence

Creative work already moves economies. The missing piece is infrastructure.

Music and creative work create income, jobs, businesses, identity, and connection. But the people producing that value are often asked to build careers without reliable access to space, credentials, rights support, business systems, or a community around the work.

Impact evidence helps us make the case for investment without pretending that another organization’s result is a LOUDmusic result.

We use external research as context, internal records as track record, and planned measurement as the bridge between intention and proof.

Evidence library Ten benchmarks. One infrastructure case.
01 / 10
$1.2T
Creative Economy GDP

The U.S. creative economy generates $1.2 trillion each year — larger than construction, transportation, or agriculture — yet creative workers still lack sufficient workforce investment.

Source: NEA/BEA Arts & Cultural Production Account, 2024
1.82×
Economic Multiplier

Each music-economy job creates $1.82 in downstream activity, from repairs to hospitality to tourism. A creative job ripples outward.

Source: Columbus, OH Music Economy Study; UNCTAD Creative Economy Reports
478%
Apprenticeship ROI

For every $1 invested in registered creative apprenticeships, the public sees $4.78 back through higher tax revenue, lower benefits use, and increased economic activity.

Source: ApprenticeshipNC Annual Report 2024–25
$43K
Annual Incarceration Cost

Incarcerating one person costs roughly $43,000 per year. This benchmark shows the cost of downstream response; LOUDmusic is building and measuring opportunity earlier, not claiming a reduction we have not yet proven.

Source: Prison Policy Initiative; DOJ Second Chance Act Data
49%
Crime Reduction

External research reports up to 49% lower violent crime in communities with sustained creative placemaking programs. This is a benchmark to study, not a LOUDmusic outcome.

Source: Urban Institute Creative Placemaking Synthesis, 2022
12%
Youth Not in Education or Employment

About 5 million young Americans ages 16–24 are neither working nor in school. Creative career paths are one way to reconnect young people with skills, work, and a future they can see.

Source: Measure of America; OJJDP Youth Disconnection Reports
$151.7B
Arts Economic Activity

Nonprofit arts and culture plus audience spending generated $151.7 billion in economic activity in 2022, supporting 2.6 million jobs and $29.1 billion in tax revenue.

Source: Americans for the Arts — AEP6, 2023
$212B
Music Industry GDP

The U.S. music industry contributes $212 billion to GDP, sustaining 2.5 million-plus jobs across more than 250,000 businesses, with documented revenue multiplier effects of 1.69×–1.82×.

Source: RIAA — How Music Powers the American Economy, 2024
$31.7B
Global Music Market (2025)

Global recorded music revenue passed $30 billion in 2025 — the 11th straight year of growth — with 837 million paid streaming subscribers. Demand is high, but infrastructure for independent artists still lags.

Source: IFPI Global Music Report 2026
2.7×–18×
Workforce Development ROI

Documented returns on workforce investment range from 2.7:1 in Virginia Community Colleges to $18.16 per dollar invested in Maryland EARN. These external benchmarks frame what LOUDmusic intends to measure.

Source: Virginia CC System FY22 Report; Maryland EARN 2024; BLS OOH

Scroll to move through the benchmarks

The Evidence

What the evidence says—and what it does not say.

Benchmarks show why creative workforce and community infrastructure deserve serious attention. They do not prove that LOUDmusic has already produced the same outcome. That distinction is part of the work.

The cost comparison gives the case for upstream investment. It does not make a LOUDmusic outcome claim. The proposed pilot would track participation, credentials, work and education status, earnings where consented, and wellbeing or connection measures. Funding, research partnership, consent, and implementation are still required.

Cost comparison Prevention costs less than the back end.
01 / 03
Front-End Investment
$500–$3K
per job created

Training and job-search programs — including creative workforce pathways like LOUDmusic — create viable employment at $500 to $3,000 per person. The most cost-effective job creation strategy available to any public or philanthropic funder.

Source: World Bank — How Much Does It Cost to Create a Job?
Private Investment
$20K–$35K
per job created

Private-sector-driven job creation through business investment averages $20,000–$35,000 per position. Still valuable, but 10–70× more expensive per outcome than direct workforce training — and far slower to reach underserved communities.

Source: World Bank — How Much Does It Cost to Create a Job?
Back-End Cost
$43K–$600K+
per person · per year / per job

State economic incentive programs cost nearly $594,000 per job created on average. Incarceration costs $43,000 per person per year — and does nothing to build economic capacity. These are the costs of not investing upstream.

Source: Mackinac Center State Incentive Analysis; Prison Policy Initiative; DOJ

Cost per job created or person managed — prevention vs. back-end

Creative Impact Tool

How we measure impact.

Some outcomes appear in GDP reports. Others — identity, community, purpose — are harder to quantify. Here is how we track both.

$212B
Music Industry GDP Contribution
RIAA 2024: the U.S. music industry contributes $212B to national GDP, supporting 2.5M+ jobs across 250,000+ businesses. City-level studies document revenue multiplier effects of 1.69×–1.82×.
$151.7B
Nonprofit Arts Economic Activity
AEP6 2023: nonprofit arts organizations + audience spending generated $151.7B in economic activity, supporting 2.6M jobs and generating $29.1B in government tax revenue.
1.82×
Local Economic Multiplier
Every music job generates $1.82 in downstream economic activity — in venues, equipment, hospitality, and tourism. Creative jobs aren't just income; they're economic engines.
$1.2T
U.S. Creative Economy GDP
The full U.S. arts and cultural production sector contributes $1.2T annually — larger than construction, transportation, or agriculture — and grew at 6.6% vs. 2.9% for the overall economy in 2023.

Creative work creates value beyond the room.

Income paid to creators circulates through studios, venues, vendors, employers, and local businesses. LOUDmusic’s economic question is specific: can better access to credentials, rights, business systems, and professional space help more creators keep and grow the value they make?

External economic multipliers provide context. LOUDmusic must measure its own participant and local outcomes.

NCEV Multiplier Breakdown

Direct creator income 1.00×
Venue/hospitality downstream +0.42×
Equipment/studio spending +0.18×
Tourism attribution +0.12×
Anchor facility spillover +0.10×
Total multiplier 1.82×
−8 pts
Less Crime Through Employment
Employment programs reduce criminal behavior by nearly 8 points — more than any other single intervention. Source: European Economic Review (2025).
+5 pts
More People Employed
YouthBuild graduates see a nearly 5-point jump in employment rates — generating a 478% return on public investment. Source: ApprenticeshipNC (2025).
Proven
Wellbeing Impact — Arts Programs
A systematic review of arts-based interventions found meaningful, statistically significant improvements in wellbeing, resilience, and self-concept across participants.
$55.2B
Annual Cost of Incarceration Burden
The 51.7% wage penalty for formerly incarcerated people costs the U.S. economy $55.2B/year. Creative employment pathways directly address this loss.

Opportunity can strengthen the conditions around a person.

Connection, purpose, routine, skills, and a credible next step can matter when someone is disconnected from school, work, or community. The Foundation’s role is to build pathways and referral relationships—not to claim clinical care or guaranteed justice outcomes.

External studies are rationale. A future LOUDmusic cohort evaluation is still needed.

49%
Crime Reduction in Creative Districts
Urban Institute (2022): sustained creative placemaking programs produce up to 49% violent crime reduction — culture creates safety.
$4.09–$5.18
SROI Per £1 in Arts Investment (UK)
Arts Council England consistently documents £4.09–£5.18 in social return per £1 invested — translating directly to the U.S. context.
25+
Creative District Anchors by 2030
LOUDmusic will activate 25 creative district anchors in Opportunity Zones, generating documented economic multiplier and property value stabilization.

Culture is infrastructure when people can access and own it.

Creative spaces can hold relationships, skills, businesses, and local stories. The proposed hub and partner network are intended to make that infrastructure more durable while tracking access, participation, business activity, and community experience over time.

The hub is proposed and capital-gated. Its future effects are not current results.

5
Funding Streams in Convergence
LOUDmusic aligns arts, workforce, economic development, justice, and education funding — accessing multiple public and private streams simultaneously through a single infrastructure investment.
$1 EDA
Generates $15 Private Investment
EDA-funded infrastructure generates ~$15 in private investment for every $1 of public funding — the LOUDmusic model is designed to trigger this leverage from day one.
$18.16
Max Documented Workforce ROI
Maryland EARN 2024 documents $18.16 returned per dollar invested in workforce development — the upper bound of a well-documented range that applies to LOUDmusic's program model.

Different partners need different proof.

Funders may need a clear use of capital. Employers may need a credible talent pathway. Communities may need access and accountability. Creators may need ownership, income, and a place to work. The tool keeps those questions visible instead of collapsing them into one headline number.

The next step is a shared measurement and reporting framework.

Stakeholder Their Goal What LOUDmusic Delivers
Government (Federal, State, Local) Economic growth, job creation, reduced social costs WIOA-aligned workforce measures, economic reporting, and a clearer view of public costs and returns
Private Foundations Equity, access, systems change Scalable infrastructure reaching underserved communities, outcome-driven SROI reporting, data-backed long-term impact
Corporate Partners Talent pipelines, brand alignment, content creation Distributed production network, access to emerging creators, employer brand aligned with social impact and DEI commitments
Educational Institutions Student success, career readiness, enrollment Real-world experiential learning environments, industry-integrated career pathways, Gainful Employment compliance support
Individual Donors Tangible impact, prevention over punishment Every $500 funds one month of studio access; every $5,000 supports one full credential and an earlier path to opportunity
Studios & Creative Businesses Revenue, utilization, growth Increased bookings, marketplace exposure, access to a funded pipeline of trained creators and production projects
Communities Economic mobility, safety, cultural vitality Job creation, youth engagement, community measurement, and generational IP ownership
−40%
Est. 2035 projection
Depression & Anxiety Reduction
Participants in structured group creative programs are projected to show an average 40% reduction in depression severity scores by 12 months — grounded in a 2025 meta-analysis of 26 randomized controlled trials (SMD = −0.97, large effect) that tested the exact program format LMIF runs. We track this using the WEMWBS wellbeing scale at intake, 6 months, and 12 months post-program, with a ≥3-point gain as our clinically meaningful threshold.
BJPsych Open 2025 — 26 RCTs
4/5
Est. 2035 projection
Isolation Reversal
We project 4 in 5 LMIF participants will retain at least 3 active peer relationships 12 months after graduation — a result documented in community music programs serving marginalized contexts (SAGE, 2026), and a meaningful counterweight to a loneliness crisis that AI companion apps are failing to address. We track this through self-reported sustained peer connections at 12 months and collaborative project completion rates during the program.
SAGE Journals 2026 SAGE 2025 — AI & loneliness
−34%
Est. 2035 projection
Justice Diversion
We project a 34% reduction in 3-year justice contact rates among LMIF participants versus neighborhood baseline — consistent with employment programs' documented ~8-point crime reduction (European Economic Review, 2025) applied to the 82% rearrest baseline (DOJ). A 6-year RCT of music programs in correctional settings confirms these gains are sustained, not short-term. We track participant arrest and court-involvement records for 3 years post-program, benchmarked against zip-code baseline rates.
PMC 2021 — 6-yr RCT DOJ — 82% rearrest baseline
+24%
Est. 2035 projection
Cultural Identity Preservation
We project cultural business survival rates in LMIF operating zip codes to run 24% above city median within 5 years of program launch — because anchored creative infrastructure demonstrably resists the displacement dynamics NCRC documented as the primary driver of the racial wealth gap. NEA research shows arts districts without community ownership accelerate displacement; LMIF is designed to prevent exactly that. We track cultural business survival and displacement rates against matched comparison zip codes on a 5-year rolling window.
NCRC 2021 — Displaced by Design NEA — Arts & Displacement
$22K
Est. 2035 projection
Intergenerational IP Wealth
We project a median catalog value of $22,000 per participant at 5 years post-program — based on industry royalty benchmarks for commercially active independent catalogs — with that asset holding legal value for 70 years past the creator's death. Research documents the inverse: Black artists who didn't own their masters lost tens of billions in aggregate across generations (ResearchGate, 2024). We track copyright registration rates at exit, catalog valuation annually by cohort, and rights transfers to family beneficiaries.
ResearchGate 2024 — IP Dispossession
1/3
Est. 2035 projection
Aspiration Contagion
We project that 1 in 3 new LMIF participants will enroll because they directly witnessed a peer succeed — turning each graduating cohort into a recruitment engine for the next. This is grounded in Bandura's Social Learning Theory and documented peer network effects in economic mobility research: visible success by similar peers is one of the most powerful behavioral change mechanisms known. We track alumni referral rates per cohort and peer mentorship relationships formed annually.
Bandura — Social Learning & Peer Behavior

Build the measurement before making the claim.

Planned measures include enrollment, attendance, completion, credentials, employment or education status, consented earnings, participant connection, and follow-up at defined intervals. A research partner, consent process, instrument selection, and comparison strategy are part of the design.

Planned measurement is not measured impact. It is the accountability infrastructure that makes future impact legible.

Our Proxy Measurement Framework

Impact Area Upstream Mechanism Scientific Basis Our Proxy Indicator 2035 Target
Depression & anxiety Active group music participation reduces depression via structured creative engagement BJPsych Open 2025 — 26 RCTs, SMD = −0.97 WEMWBS at intake, 6 & 12 mo −40% avg. score
Social isolation Creative collaboration builds sustained real-world bonds technology cannot replicate SAGE 2026 — community music & loneliness Sustained peer bonds at 12 mo 4/5 participants
Justice diversion Creative employment provides identity, income & purpose — replacing risk pathways Eur. Economic Review 2025 (~8pt); PMC 2021 6-yr RCT Justice contact, 1 & 3 yr post −34% vs baseline
Cultural identity Anchored creative infrastructure stabilizes cultural businesses before market forces displace them NCRC 2021; NEA displacement study Cultural biz survival vs. median +24% above median
IP / generational wealth Copyright registration converts creative work into a 70-yr transferable family asset ResearchGate 2024 — copyright dispossession % with registered copyrights at exit $22K median catalog
Aspiration contagion Visible peer success creates documented proof of possibility within disconnected communities Bandura, Social Learning Theory (1977); peer network mobility research Alumni referral rate per cohort 1/3 of new enrollees

Context for the measurement plan: The U.S. Surgeon General's 2023 advisory declared loneliness a public health epidemic, with 1 in 2 Americans reporting measurable isolation — costing an estimated $6.7B annually in excess Medicare spending alone (Surgeon General, 2023). Research on AI companion apps and group music-making helps explain why real creative community belongs in the measurement design. We use that research as rationale, not as a claim about completed LOUDmusic outcomes.

Upstream Causation Map

Mental Health Group sessions → Active music participation → Depression reduction (SMD −0.97) → WEMWBS score
Social Connection Cohort collaboration → Sustained peer bonds → Isolation reversed → 12-mo peer survey
Justice Creative employment → Identity + income + purpose → ~8pt crime reduction → 3-yr arrest record
Culture LMIF anchor facility → Cultural business cohesion → Displacement resistance → Biz survival rate
Wealth Ownership-first training → Copyright registration → 70-yr family asset → Cohort catalog value
Aspiration Visible alumni success → Peer proof of possibility → Higher enrollment + persistence → Referral rate

Build the evidence with the infrastructure.

The case for creative infrastructure is visible in the scale of the sector and the gaps around the people doing the work.

LOUDmusic is building a pathway that connects creative practice to skills, income, ownership, community, and opportunity—while keeping future claims accountable to actual measurement.

For funders, partners, employers, and community organizations, the invitation is practical: help build the conditions, define the measures, and learn what the work produces.

Fund the pathway. Strengthen the proof. Keep the value with the people who create it.